Incomprehensible errors
Table of Contents

As you’ve probably gathered from the previous articles, I mostly do iOS and Android mobile. But from time to time, I go outside this mobile bubble to do other things.
The interesting thing about doing Xamarin for mobile is that it’s easy to port our application to desktop environments. But when I left my iOS and Android cocoon, I quickly realized that the tools for desktop development were not necessarily as advanced as their smartphone brother.
And finally: especially on MacOS!
The problem #
From time to time during the development of one of my applications, I found myself with crashes of this one without stacktrace or exception that .NET had accustomed me to until now. But only a good old dump like this one :
=================================================================
	Native Crash Reporting
=================================================================
Got a abrt while executing native code. This usually indicates
a fatal error in the mono runtime or one of the native libraries
used by your application.
=================================================================

=================================================================
	Native stacktrace:
=================================================================
	0x1041d28a6 - /Users/myUser/Documents/Projects/MyApp/MyApp/bin/Debug/MyApp.app/Contents/MacOS/MyApp : mono_dump_native_crash_info
	0x1041c647e - /Users/myUser/Documents/Projects/MyApp/MyApp/bin/Debug/MyApp.app/Contents/MacOS/MyApp : mono_handle_native_crash
	0x1041d1eaf - /Users/myUser/Documents/Projects/MyApp/MyApp/bin/Debug/MyApp.app/Contents/MacOS/MyApp : sigabrt_signal_handler
	0x7fff2039fd7d - /usr/lib/system/libsystem_platform.dylib : _sigtramp
	0x7fff20326133 - /usr/lib/system/libsystem_kernel.dylib : host_create_mach_voucher
	0x7fff20348fef - /usr/lib/system/libsystem_kernel.dylib : __darwin_check_fd_set_overflow.cold.1
	0x7fff24b010ae - /System/Library/PrivateFrameworks/TCC.framework/Versions/A/TCC : __TCCAccessRequest_block_invoke_2
	0x7fff24b018df - /System/Library/PrivateFrameworks/TCC.framework/Versions/A/TCC : __TCCAccessRequest_block_invoke.138
	0x7fff24aff504 - /System/Library/PrivateFrameworks/TCC.framework/Versions/A/TCC : __tccd_send_message_block_invoke
	0x7fff200a1a9c - /usr/lib/system/libxpc.dylib : _xpc_connection_reply_callout
	0x7fff200a1a24 - /usr/lib/system/libxpc.dylib : _xpc_connection_call_reply_async
	0x7fff201b0870 - /usr/lib/system/libdispatch.dylib : _dispatch_client_callout3
	0x7fff201c9035 - /usr/lib/system/libdispatch.dylib : _dispatch_mach_msg_async_reply_invoke
	0x7fff201c051c - /usr/lib/system/libdispatch.dylib : _dispatch_kevent_worker_thread
	0x7fff203574a5 - /usr/lib/system/libsystem_pthread.dylib : _pthread_wqthread
	0x7fff2035642f - /usr/lib/system/libsystem_pthread.dylib : start_wqthread

=================================================================
	Telemetry Dumper:
=================================================================
Thread 0x30d034000 may have been prematurely finalized* Assertion at /Users/builder/jenkins/workspace/archive-mono/2020-02/mac/release/mono/utils/mono-threads.c:650, condition `info' not met, function:mono_thread_info_current,
I might as well tell you that when you read lines like :
0x1041d28a6 - /Users/myUser/Documents/Projects/MyApp/MyApp/bin/Debug/MyApp.app/Contents/MacOS/MyApp : mono_dump_native_crash_info
0x1041c647e - /Users/myUser/Documents/Projects/MyApp/MyApp/bin/Debug/MyApp.app/Contents/MacOS/MyApp : mono_handle_native_crash
0x1041d1eaf - /Users/myUser/Documents/Projects/MyApp/MyApp/bin/Debug/MyApp.app/Contents/MacOS/MyApp : sigabrt_signal_handler
We are not very serene on the way to solve this. We find ourselves without any concrete clue and we end up doing what my grandfather used to do: put print(“Foo”) everywhere to know where the code stops.
Beyond the fact that this technique is very annoying, it is also doomed to failure as soon as you manage several Threads and/or your application makes several hundreds/thousands lines of code with hundreds of different classes.
Possible solutions #
AOT #
According to Chris Hamons (https://github.com/chamons), one of the main contributors to Xamarin.Mac, you can enable Ahead Of Time compilation on your project to get a better stacktrace and therefore potentially more research and reflection on your problem.
AOT compilation is a compilation that translates a high-level language into machine language before the execution of a program, as opposed to just-in-time compilation, which is done at runtime.
Pre-compilation allows you to have a global view of the code, which is not the case with on-the-fly compilation, which can only make local optimizations. Early compilation allows to reduce the costs of exception handling and calls to methods and interfaces.
Unfortunately this technique is not always possible. In my personal case I use the SQLite library which prevents the passage in AOT.
Moreover, it is to be noted that this technique is to be applied only in debug, since the produced code is more voluminous and less fast. So remember to disable it before compiling in release.
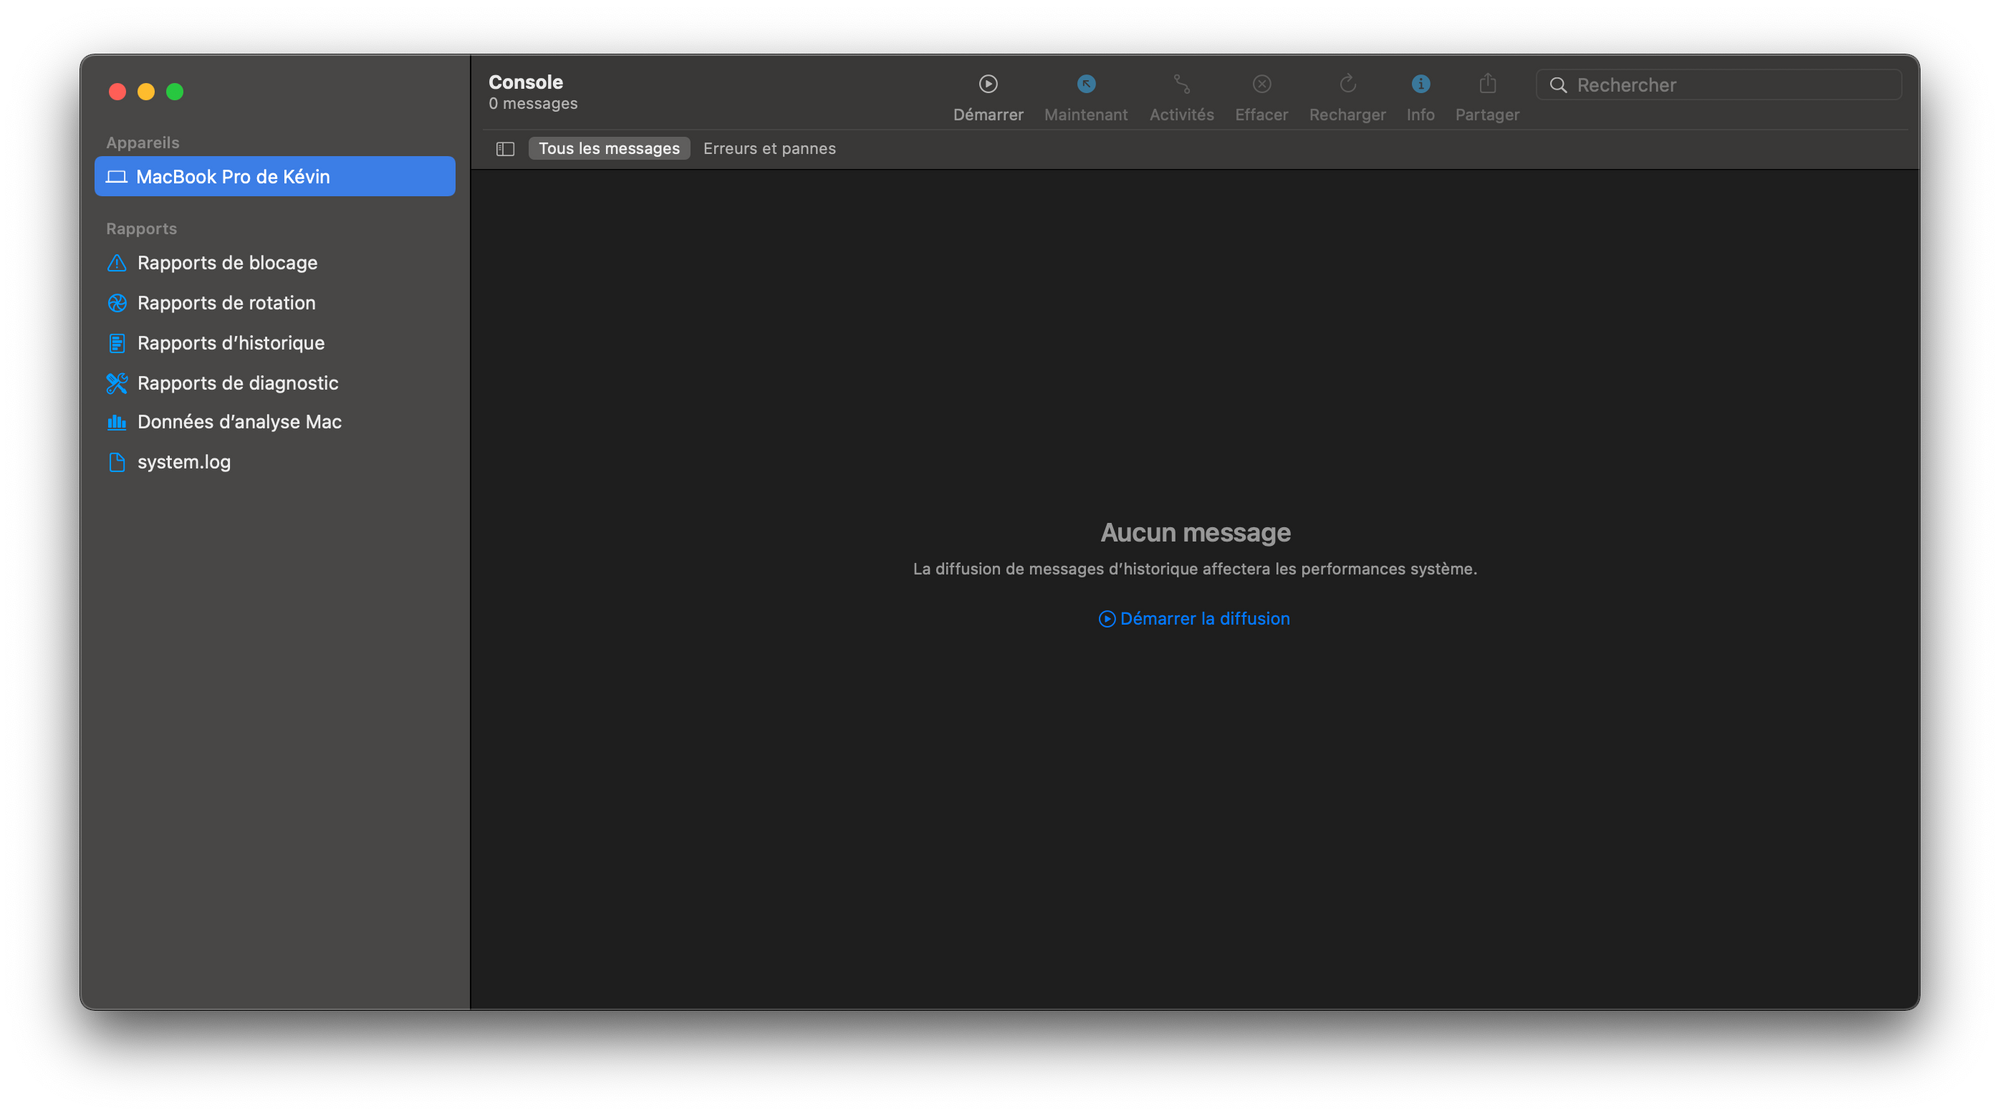
The console #
You may know it but the “Console” program on MacOS allows you to see everything that is happening on your machine. It is the equivalent of “Event Viewer” on Windows or “Logcat” on Android.
For some problems, it is my best friend. Being system specific and not linked to your application, it is able to log more information about crashes than your own application with its logger.
Moreover, belonging to the system, it has a different point of view. It will give you additional information about what the system is doing with your application: adding an event, deleting an event, system warning, certificate problem, …
How to use the console to debug? #
You will see, it is quite simple, not to say childish. First of all, open the Console application. Your application must always be turned off.
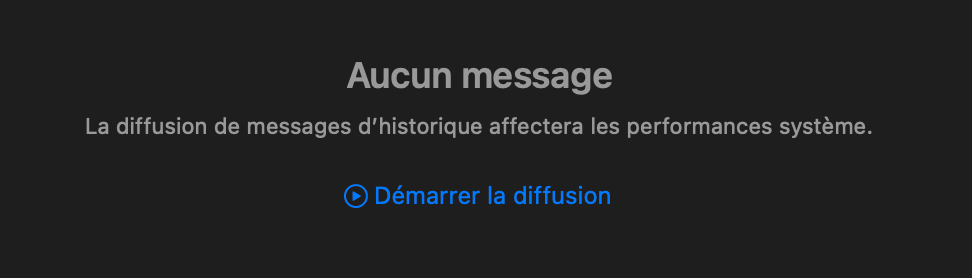
Then activate the log capture with the central button:
You will now see a large amount of logs appearing on your screen. These concern the whole system and all applications. No question of sorting out all this ourselves.
In the search bar type the name of your application or its bundle id. You will see that normally all the logs will disappear to leave a blank page.
Now launch your application in debug and try to reproduce your crash.
The logs will start to appear. Of course, all the logs do not necessarily represent an error. It is all the information that the system sees fit to expose.
Once your crash has been reproduced, go to the console and look at the last logs present in the console, they will surely help you! In my case, for example, it was a lack of permission in the Info.plist. And I was able to find this out thanks to this line:
Refusing authorization request for service kTCCServiceBluetoothAlways and subject Sub:{com.kevinsibue.myapp}Resp:{identifier=<ID of InvalidCode>, pid=11337, auid=501, euid=501, binary_path=/Users/myUser/Documents/Projects/MyApp/MyApp/bin/Debug/MyApp.app/Contents/MacOS/MyApp} without NSBluetoothAlwaysUsageDescription key
So we are far from the original dump that made me want to tear my hair out. And at least here the error is clear! Our application is killed because it doesn’t have in the Info.plist the NSBluetoothAlwaysUsageDescription key. I just have to add it to make the error disappear.
Crashes #
In general, if your application crashes, we are never sure to have the information in the application logs.
The method we have seen before is interesting but requires to open the console before using the application. And clearly your customers won’t do it and maybe your testers won’t either.
The first solution would be to set up a bug reporter like AppCenter or Firebase Crashlytics. They work very well for mobile. But no such luck for Xamarin.Mac applications.
Fortunately, it is possible to access the crash log directly on your Mac.
Still in the Console application, and you will be in the left sidebar, subsection “Report” the item “Blocking report”. This one will contain all the crash logs recorded by the system for your application!
Process:               MyApp [11218]
Path:                  /Users/USER/Documents/*/MyApp.app/Contents/MacOS/MyApp
Identifier:            com.kevinsibue.myapp
Version:               48.8 (1)
Code Type:             X86-64 (Translated)
Parent Process:        ??? [1]
Responsible:           MyApp [11218]
User ID:               501
Date/Time:             2021-06-12 16:16:10.842 +0200
OS Version:            macOS 11.4 (20F71)
Report Version:        12
Anonymous UUID:        ACE4D874-1610-4A86-D6EE-681EE74AD581
Sleep/Wake UUID:       E83C9115-81A1-4AF3-91E2-BE359E9F4A2B
Time Awake Since Boot: 28000 seconds
Time Since Wake:       460 seconds
System Integrity Protection: enabled
Crashed Thread:        7  Thread Pool Worker
Exception Type:        EXC_BAD_ACCESS (SIGABRT)
Exception Codes:       KERN_INVALID_ADDRESS at 0x0000000000000000
Exception Note:        EXC_CORPSE_NOTIFY
VM Regions Near 0:
-->
    __TEXT                      104738000-104cd0000    [ 5728K] r-x/r-x SM=COW  /Users/*/Documents/*/MyApp.app/Contents/MacOS/MyApp
Application Specific Information:
abort() called
Thread 0:: tid_103  Dispatch queue: com.apple.main-thread
0   ???                           	0x00007ffe94316ab8 ???
1   libsystem_kernel.dylib        	0x00007fff203252ba mach_msg_trap + 10
2   com.apple.CoreFoundation      	0x00007fff204538c5 __CFRunLoopServiceMachPort + 316
3   com.apple.CoreFoundation      	0x00007fff20451f7b __CFRunLoopRun + 1332
4   com.apple.CoreFoundation      	0x00007fff20451380 CFRunLoopRunSpecific + 567
5   com.apple.HIToolbox           	0x00007fff288f1ab3 RunCurrentEventLoopInMode + 292
6   com.apple.HIToolbox           	0x00007fff288f1815 ReceiveNextEventCommon + 587
7   com.apple.HIToolbox           	0x00007fff288f15b3 _BlockUntilNextEventMatchingListInModeWithFilter + 70
8   com.apple.AppKit              	0x00007fff22b7c6f2 _DPSNextEvent + 864
9   com.apple.AppKit              	0x00007fff22b7aec5 -[NSApplication(NSEvent) _nextEventMatchingEventMask:untilDate:inMode:dequeue:] + 1364
10  com.apple.AppKit              	0x00007fff22b6d239 -[NSApplication run] + 586
11  com.apple.AppKit              	0x00007fff22b4147c NSApplicationMain + 816
12  ???                           	0x0000000118183147 ???
13  ???                           	0x0000000118182df3 ???
14  ???                           	0x0000000110fd97fb ???
15  ???                           	0x0000000110fd9971 ???
16  com.kevinsibue.myapp         	0x00000001048631ce mono_jit_runtime_invoke + 1550 (mini-runtime.c:3191)
17  com.kevinsibue.myapp         	0x00000001049982d8 do_runtime_invoke + 54 (object.c:3052) [inlined]
18  com.kevinsibue.myapp         	0x00000001049982d8 mono_runtime_invoke_checked + 136 (object.c:3220)
19  com.kevinsibue.myapp         	0x000000010499f605 do_exec_main_checked + 60 [inlined]
20  com.kevinsibue.myapp         	0x000000010499f605 mono_runtime_exec_main_checked + 117 (object.c:5284)
21  com.kevinsibue.myapp         	0x00000001047bf59c mono_jit_exec_internal + 14 (driver.c:1383) [inlined]
22  com.kevinsibue.myapp         	0x00000001047bf59c mono_jit_exec + 364 (driver.c:1328)
23  com.kevinsibue.myapp         	0x00000001047c2696 main_thread_handler + 71 (driver.c:1465) [inlined]
24  com.kevinsibue.myapp         	0x00000001047c2696 mono_main + 8790 (driver.c:2714)
25  com.kevinsibue.myapp         	0x00000001047775bc xamarin_main + 1116 (launcher.m:656)
26  com.kevinsibue.myapp         	0x0000000104778434 main + 36 (launcher.m:675)
27  libdyld.dylib                 	0x00007fff20375f5d start + 1
And these logs are available even without activating the console before a test. Quite practical!
There is already a very good article from Microsoft on the subject: https://docs.microsoft.com/fr-fr/xamarin/mac/deploy-test/debugging-native-crash. I invite you to read it to better manage these error cases.